A week ago we shared a finding on r/ethereum: 76% of new Ethereum tokens are scams. The best replies were not “you’re wrong.” They were two sharp methodology critiques. We ran both. Here is what changed.
1. “Is the rise real, or is your detector just drifting?”
The critique was clean: if the scam rate climbs over time but the detector also changed, you cannot separate the two. Any rise could be new rules, not new rugs.
So we froze a cohort. We keep three snapshots per token at a fixed threshold: at deploy (J0), at day 7, and at day 30. We took the 25,931 tokens that have both a J0 and a J30 snapshot. Nothing new enters that set. If the rate rises inside it, it is not the population changing.
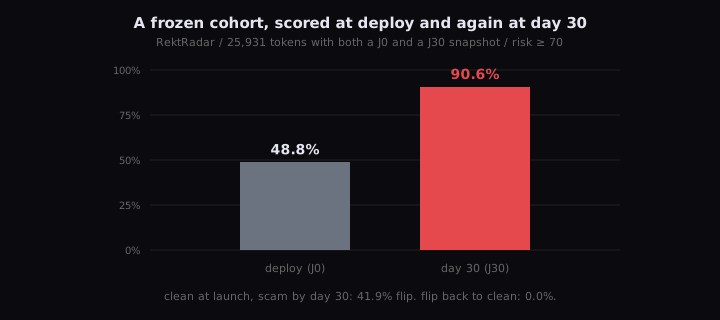
Inside the frozen set: 48.8% flagged at deploy, 90.6% by day 30. Zero flipped back to clean.
That last number is the tell. A drifting detector re-labels tokens in both directions as its rules change. Ours only goes up. To be sure, we decomposed which flags fired late for the tokens that flipped from clean to scam.
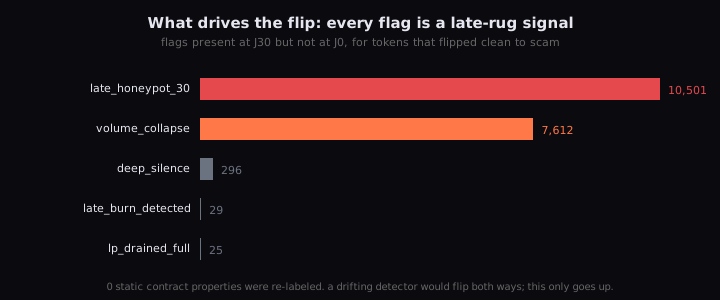
Every single flag is a time-dependent rug signal: a honeypot that activated after launch (10,501 tokens), volume collapse (7,612), late burns, LP drains. None were static contract properties getting re-labeled. So the rise is not detector drift. It is rugs that happen after launch. A token clean at deploy has roughly a 42% chance of turning scam by day 30. That is the argument for monitoring a token over time, not scoring it once at birth.
2. “The count is the surface. Who is behind it is the signal.”
Also fair. 76% is spam-email math: the count of bad things says nothing about who makes them or how much harm they do. The commenter pointed straight at the interesting part, our bytecode clustering, and asked for the number.
So we clustered every scam by its contract bytecode.
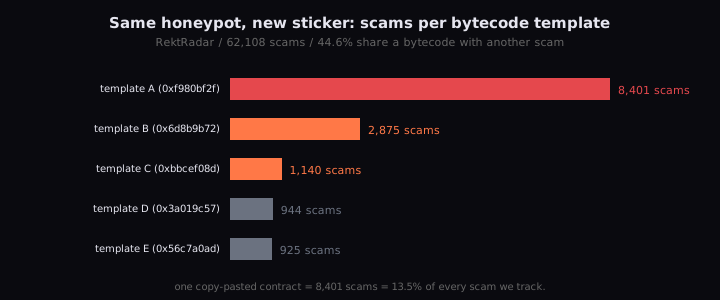
44.6% of scams share a bytecode with another scam. One single template is behind 8,401 of them, which is 13.5% of every scam we track. Several templates are 100% scam: pure factories. Same honeypot, new sticker, new ticker. And this is bytecode alone. Add the funding graph, where a common funder wallet seeds the deploy wallets, and the concentration tightens further.
That is the point the commenter was making, and the data backs it hard: the useful signal was never “76%.” It is the actor graph. A single deployer or template can manufacture thousands of “different” tokens, and no individual trader can reconstruct that cross-token view by hand.
What we changed
- We stopped leading with the raw count. We lead with harm and with the actor graph.
- The honest gap we are closing next: precision and recall against a hand-labeled holdout. We do not have that number yet. We are building it, and we will publish it whatever it says.
This is what good adversarial feedback looks like. It did not move the headline much, but it made the claim defensible and it sharpened what we measure. Thanks, r/ethereum.
You can see the per-token version of all of this on any analysis, and pull the signals through our free API.
Numbers from RektRadar’s live index as of 22 July 2026. Frozen cohort: tokens with both a deploy-time (J0) and day-30 (J30) risk snapshot at a fixed threshold of 70. Bytecode clusters: tokens grouped by contract code hash, scam defined as risk score 70 or higher.