We have scored 107,596 ERC-20 tokens on Ethereum mainnet, every one that opened a Uniswap v2/v3/v4 pool, at a risk threshold of 70 out of 100. About 60% get flagged. That number sounds alarming and slightly unbelievable at the same time, which is the right reaction, because on its own it is nearly useless. Two cuts of the same data make it useful, and both go the opposite way from what most people expect.
1. The scam rate rises with liquidity
The obvious objection to “60% of tokens are scams” is the denominator. Most of those 107k tokens never saw a second trade. They are dust: a pool that got created, maybe seeded with a few dollars, and abandoned. So condition on pools that actually held real money. The intuition is that the rate should drop once you throw out the dust.
It rises.
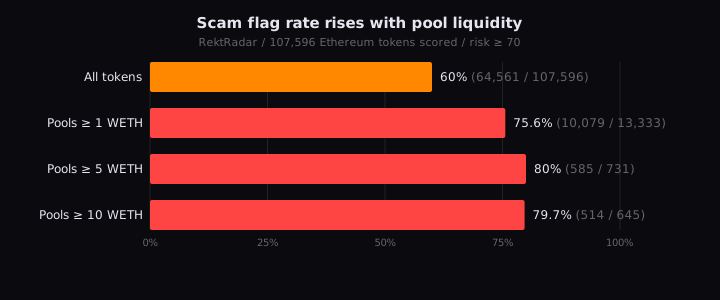
Restrict to pools that ever held at least 1 WETH and the flag rate goes from 60% to 75.6%. Push the floor to 5 WETH and it is 80%. The dust in the denominator was not hiding scams. It was hiding dead tokens, deploys nobody ever traded, which are not scams because there was nothing to lose on them.
It is obvious in hindsight: a rug needs liquidity to drain, and a honeypot needs someone to trap. The pools with real WETH in them are exactly where the incentive to scam lives. Roughly four out of five pools a human could actually have bought into get flagged. “Filter out the scams and trade the rest” is not a strategy on this chain, it is most of the chain.
2. The pool-level metric inverts with risk
So the flagged, liquid pools are where the danger is. You would expect that if you measure realized on-chain outcomes, the higher-risk pools show worse outcomes for buyers. We measured it: for every pool, what fraction of the WETH that buyers put in did they get back out.
The result was humbling. Measured at the pool level, the higher the risk score, the better buyers appear to recover.
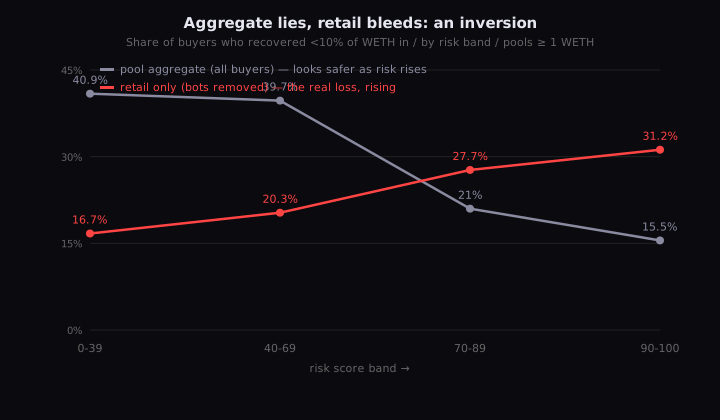
The grey line is the trap. Take it at face value and a token scored 90+ looks safer than one scored 30. That is the base-rate trap one level down, and it is exactly the failure mode a good analyst should be paranoid about: a metric that makes the model look great can be measuring the wrong population.
3. The tell: the money in the flagged pools is not retail money
Here is what the aggregate is actually measuring. The pools our model flags are the loud, obvious degen launches, and those attract snipers and coordinated bot fleets. Look at how much WETH gets bought into a pool, by risk band:
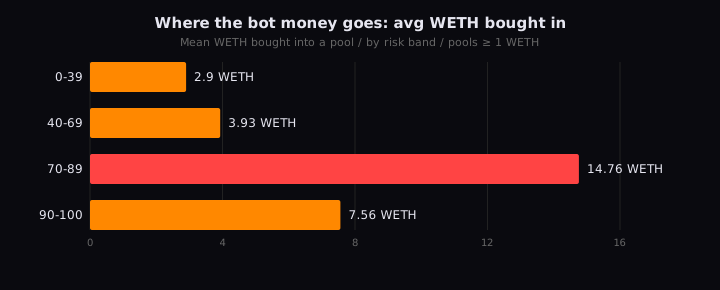
Average WETH-in per pool jumps from about 3 in the low-risk bands to nearly 15 in the flagged band. That extra money is not patient retail. It is bots that pile into the obvious plays, buy and dump in the same few blocks, and get their WETH back out cleanly. Because the pool aggregate sums everyone together, that fast bot money inflates the “recovery” number and drowns out the retail that stayed in and got trapped.
4. Who actually loses
Segment the wallets. We already fingerprint serial scam-pool bots, the addresses that show up as early buyers across dozens of scam pools. Strip them out and re-measure the outcome for retail buyers only, and the line flips (the red line above). Retail buyers stuck with under 10% of their WETH back climbs from about 17% in the low-risk band to 31% in the highest. The flag was right the whole time. It just predicts retail harm, which the pool aggregate hides.
Honest caveat: the retail sample in the low-risk bands is still thin, so treat the exact low-end numbers as directional rather than final. The direction, though, is unambiguous and it is the opposite of the aggregate.
The takeaway
A checker that tells you “honeypot / not honeypot” at launch is answering the easy, commoditized question. The two things that actually predict whether you lose money are not in that answer:
- How much real liquidity the pool held. Danger concentrates in the pools that look tradeable, not the dust.
- Who the other buyers are. If the early buyers are a known bot fleet, the pool aggregate will look fine while retail gets bagged.
That is the difference between scoring a contract and monitoring a market. We publish the per-token version of this on every analysis and expose the signals through a free API. The scam rate is not 60%, and it is not 80% either. It depends on which pool you are standing in, and who is standing in it with you.
Numbers from RektRadar’s live index, 107,596 tokens scored at risk >= 70, as of 12 July 2026. Liquidity measured as WETH minted into the v2 pool; buyer recovery as WETH out over WETH in from on-chain swaps; retail defined as buyers not seen across multiple flagged pools.