A few people asked me what’s actually under the hood of RektRadar. Here’s the full writeup. No black box, no marketing fluff. Just the architecture diagram of how a scan goes from pasting a contract address to seeing a risk score in ~200ms.
The 4-layer setup
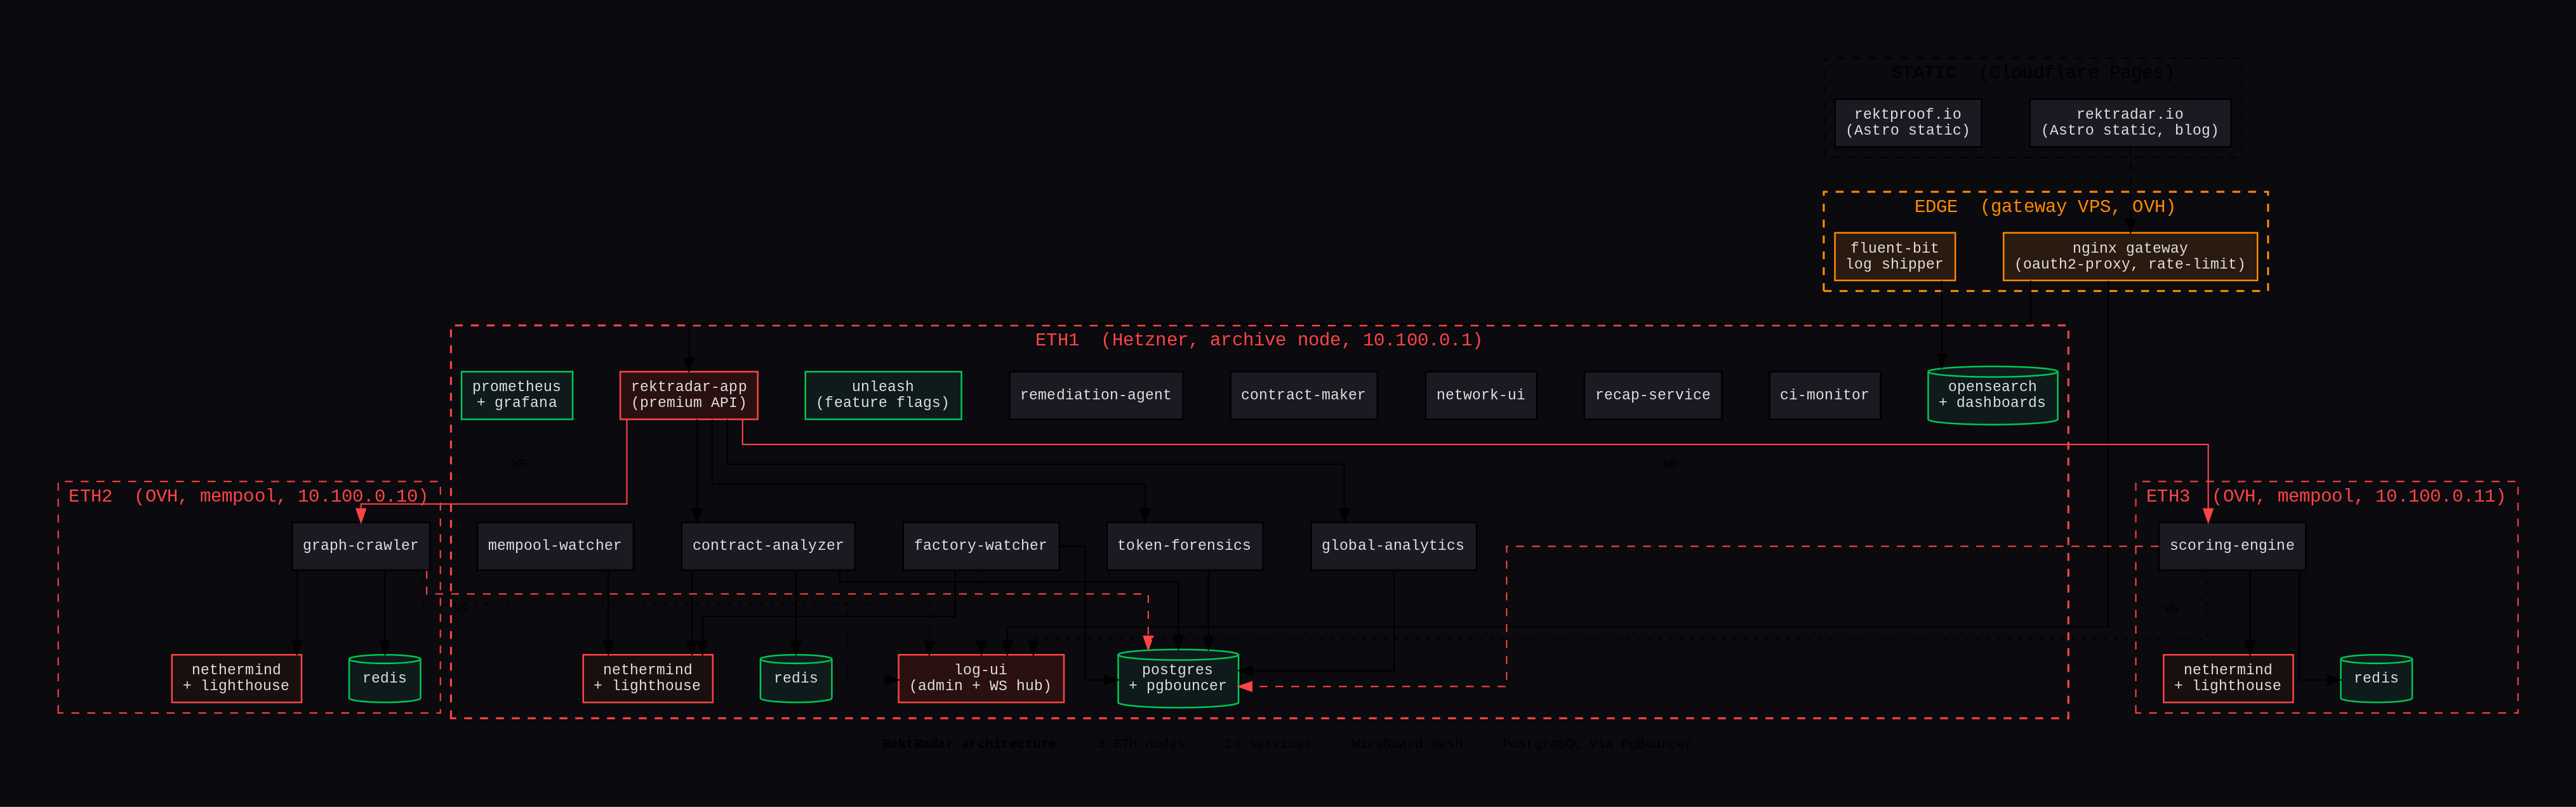
Layer 1. 3 Ethereum nodes
- eth1 (Hetzner, Germany): full archive node. Nethermind 1.36 + Lighthouse 8.1. This is where the bulk of services live.
- eth2 / eth3 (OVH, France): mempool watchers. Same Nethermind+Lighthouse stack but tuned for pending-tx ingestion. Two of them so we catch rugs in different propagation windows. A sandwich or a sneaky liquidity remove can hit one node a few seconds before the other.
- All three are bridged by a WireGuard mesh. SSH is closed except on eth1.
Layer 2. 14 microservices
- Watchers: factory-watcher (Uniswap pool creation), mempool-watcher (pending tx), graph-crawler (deployer chains, eth2), scoring-engine (eth3)
- Analyzers: contract-analyzer (honeypot simulation), token-forensics (holders + LP), global-analytics
- Tools: contract-maker, recap-service, ci-monitor, network-ui, remediation-agent
- UI: log-ui (admin + WebSocket hub), rektradar-app (premium API gateway)
Each service has its own Docker container, its own Ansible role, its own deploy pipeline, and its own health endpoint. They share one PostgreSQL via PgBouncer (1 DB, schema partitioned per service) and a Redis per chain node for cache.
Layer 3. Data plane
- PostgreSQL 16 + PgBouncer (max 500 client connections, 30 server pool)
- Redis 7 (one instance per chain node, used for scoring cache + cluster lookups)
- Unleash (feature flags so I can toggle code paths without redeploy)
Layer 4. Edge
- nginx gateway VPS (separate from eth1, on OVH). Terminates TLS, routes subdomains, runs oauth2-proxy for admin areas.
- Fluent Bit on every node, ships nginx + Docker logs to OpenSearch on eth1.
- Prometheus + Grafana for metrics, AlertManager wired to remediation-agent for auto-healing.
Hexagonal architecture (Ports & Adapters)
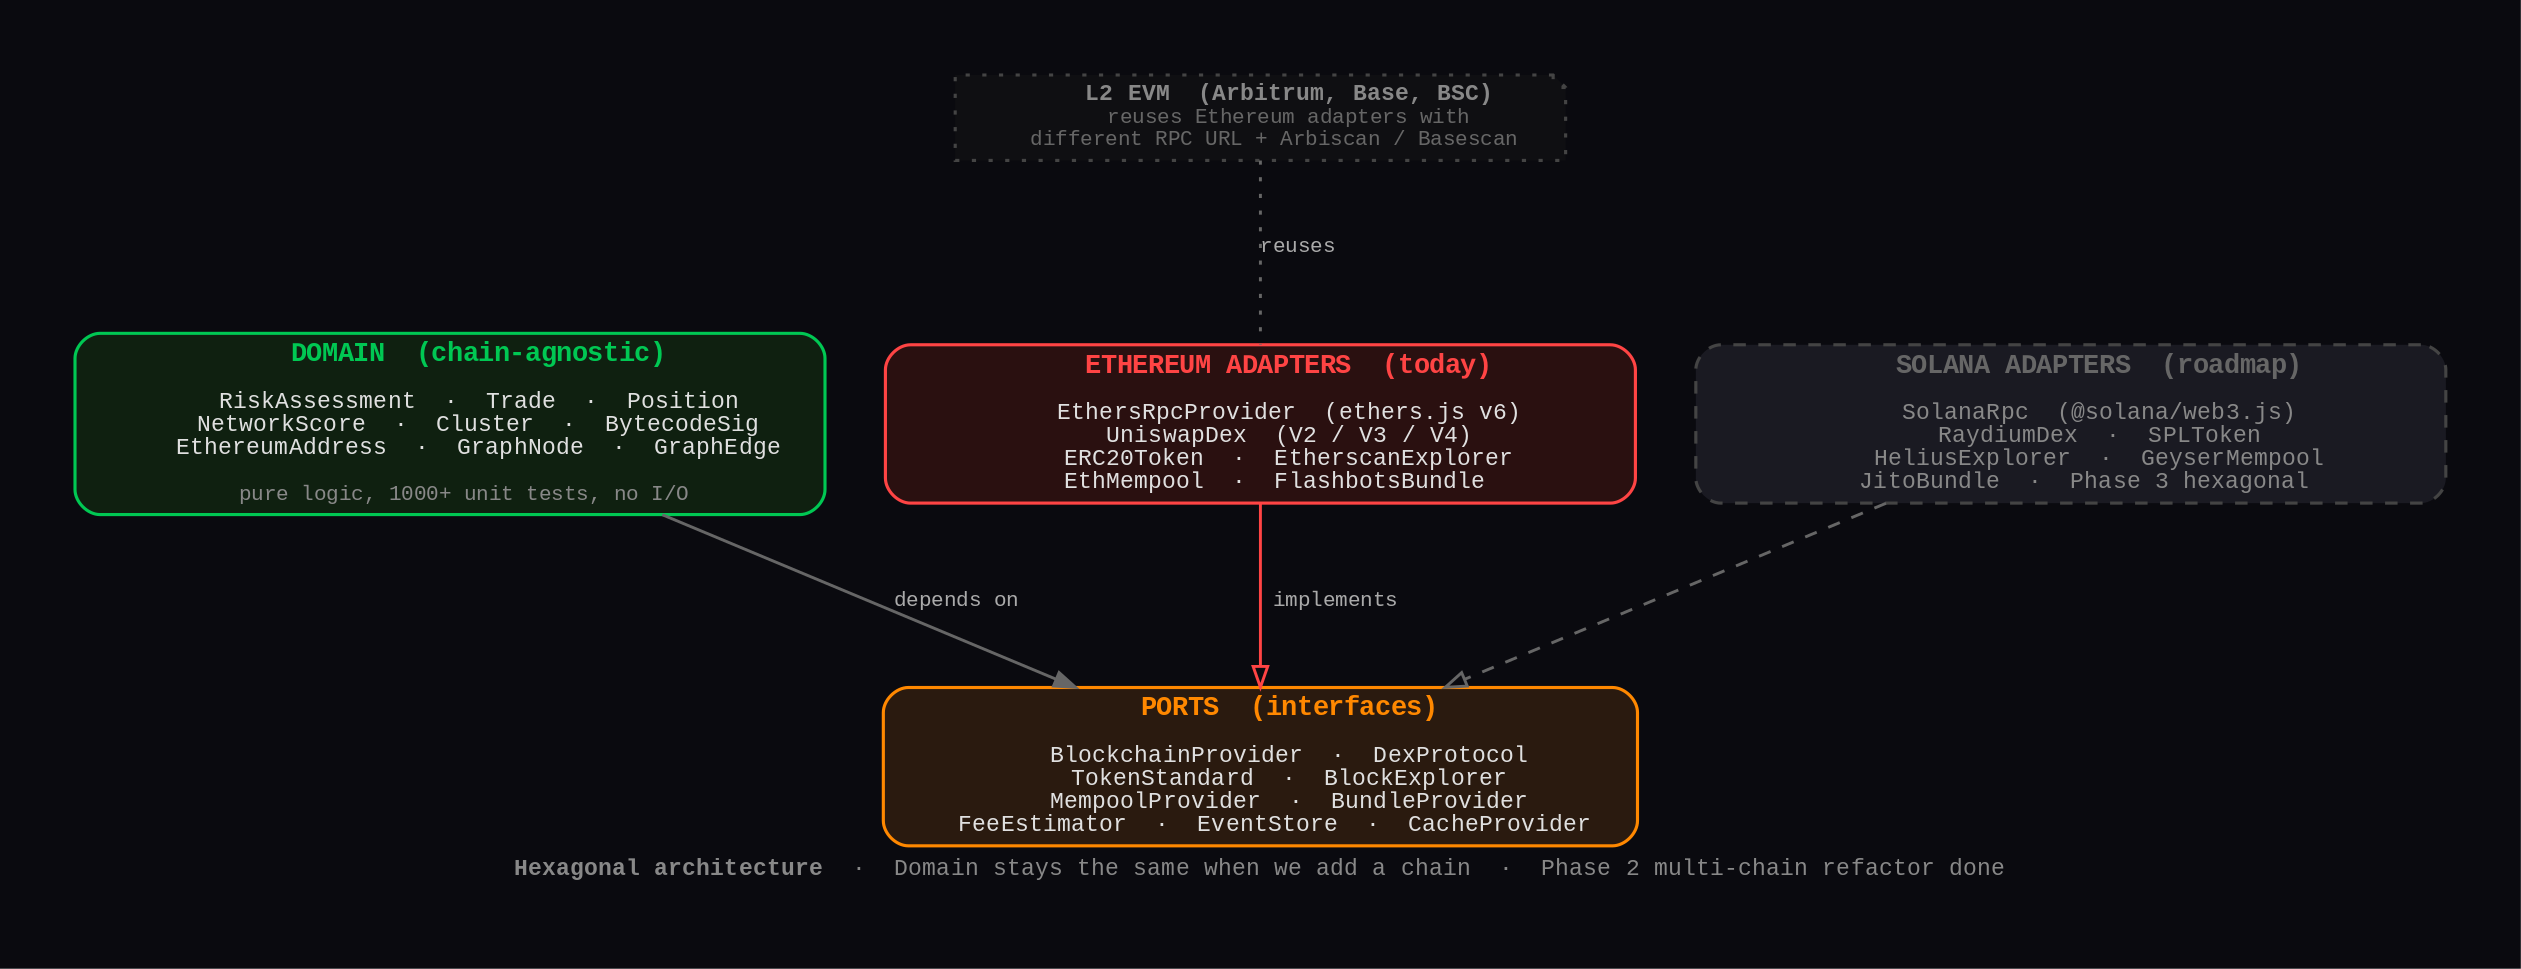
Today everything runs on Ethereum. But the long-term goal is multi-chain (Solana first, then Arbitrum / Base / BSC). The reason the codebase is decoupled the way it is:
- Domain layer is chain-agnostic:
RiskAssessment,Trade,Position,NetworkScore,Cluster,BytecodeSignature. Pure logic, ~1000+ unit tests, zero I/O. - Ports are interfaces:
BlockchainProvider,DexProtocol,TokenStandard,BlockExplorer,MempoolProvider,BundleProvider. - Adapters are the concrete implementations. Today there’s an Ethereum adapter for each port (
EthersRpcProvider,UniswapDex,ERC20Token,EtherscanExplorer,EthMempool,FlashbotsBundle).
When I add Solana, I don’t touch the domain models. I just write a SolanaRpc adapter, a RaydiumDex adapter, etc. The honeypot detector doesn’t care if the bytecode is EVM or BPF; the network funder analysis doesn’t care if it’s tracing eth_call or simulateTransaction.
L2 EVMs (Arbitrum, Base) are even cheaper. They reuse the Ethereum adapter with a different RPC URL.
6 services have completed this refactor (factory-watcher, graph-crawler, scoring-engine, contract-analyzer, mempool-watcher, log-ui). Mutation tests via Stryker on the domain models, integration tests against a real PostgreSQL.
The detection pipeline
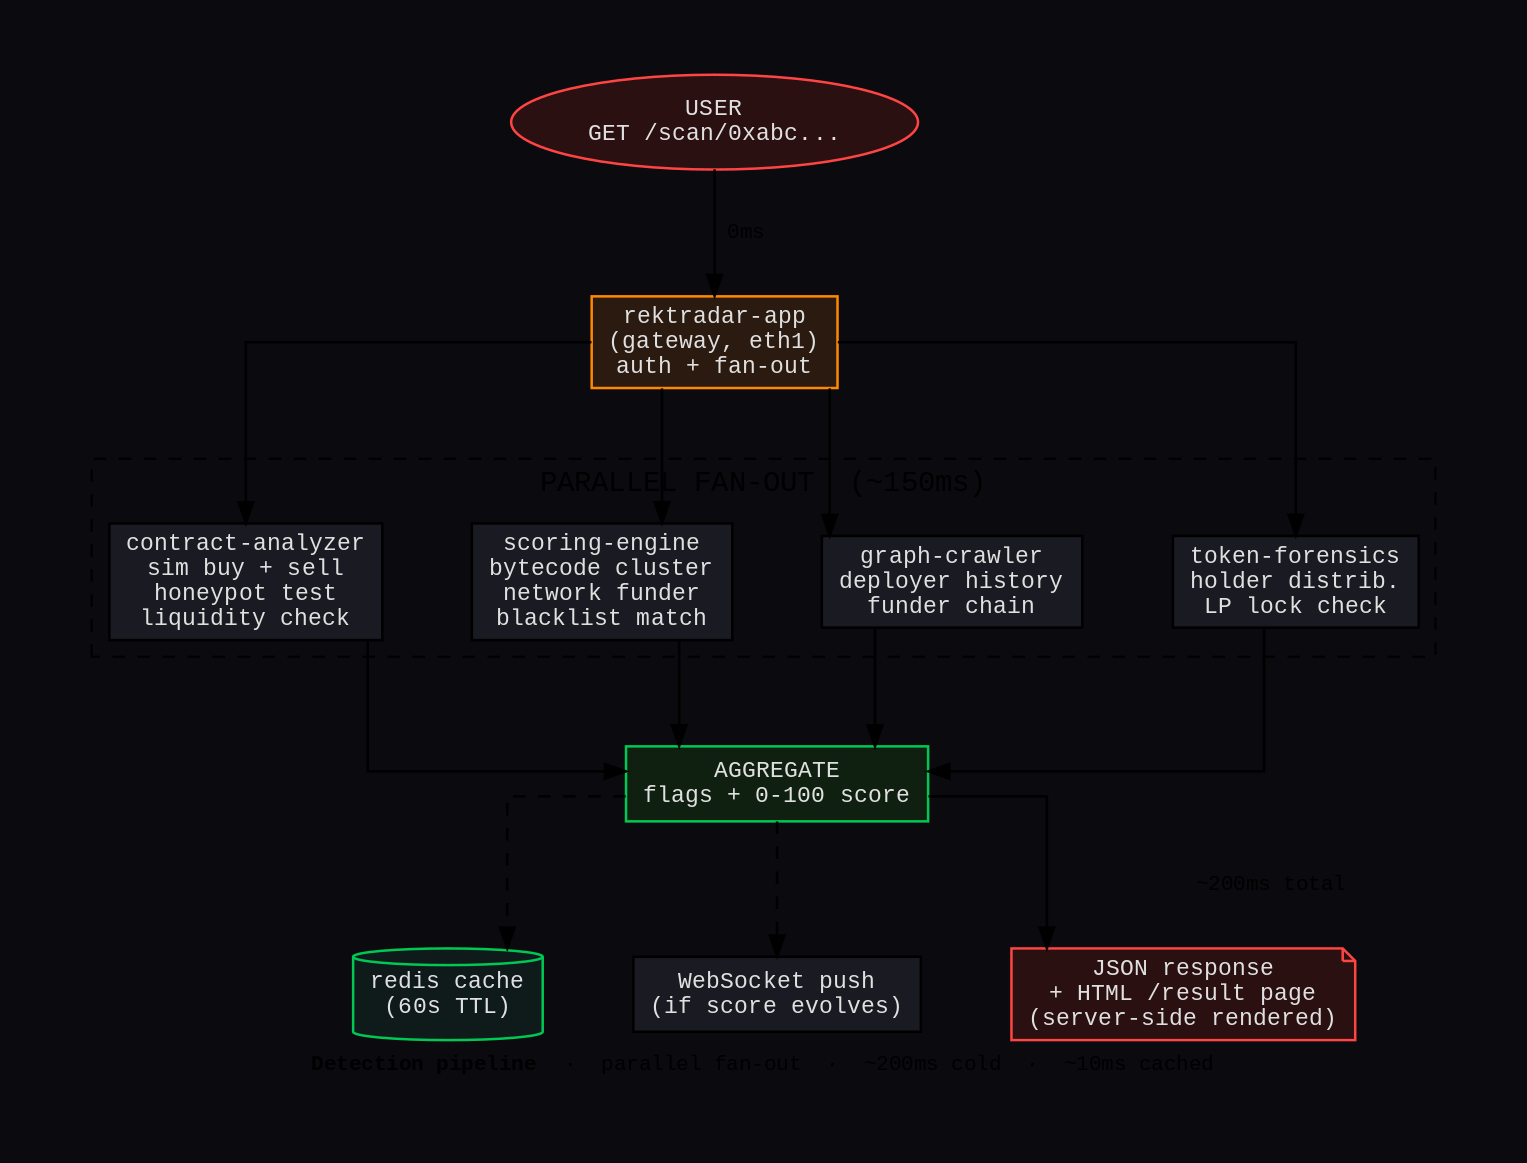
When you scan a contract on the app, here’s what happens behind the scenes:
- Request hits
rektradar-app(the gateway on eth1). Auth check, rate-limit, cache lookup. - Parallel fan-out to 4 services running concurrently:
contract-analyzersimulates a buy then a sell on a forked Ethereum state. If the sell reverts, it’s a honeypot. If the buy succeeds with massive slippage, it’s low-liquidity.scoring-enginedoes a bytecode hash bucket lookup (clusters of identical contracts indicate a factory). Also looks at the network funder: who paid for the deployer wallet’s gas, and is that funder linked to past rugs.graph-crawlerwalks back the deployer’s transaction history (previous tokens deployed, prior rugs, age of the wallet).token-forensicschecks holder distribution (top-10 concentration), LP lock status, and whether the deployer holds the LP tokens themselves.
- Aggregate the results into a 0-to-100 risk score plus flag list (
honeypot,low_liquidity,unverified_contract,deployer_history_rugs, etc.). - Cache in Redis (60s TTL) and WebSocket push to any open client viewing that token.
- Response: JSON for API consumers, server-side rendered HTML at
/result/<addr>for SEO.
Cold scan ~200ms total. Cached ~10ms. Worst case (cold + new bytecode bucket = needs disassembly) ~800ms.
What runs at the SEO and UI edge
- rektradar.io (landing + blog): Astro static, deployed on Cloudflare Pages. ~52 SEO pages, blog articles, all pre-rendered. Static = fast crawl, free hosting, no SSR overhead. I migrated from a SSR template last month, devnotes here. Big SEO win.
- app.rektradar.io: Vue 3 SPA + Vuetify, live WebSocket connection to log-ui for streaming events (new pool, new rug detected, score evolution). This part is dynamic by nature.
What’s next on the roadmap
- Solana adapter. Biggest piece of work. SPL tokens, Raydium / Orca for DEX, Jito for MEV protection, Helius for explorer, Geyser gRPC instead of mempool subscription.
- L2 EVM. Mostly config: ChainRegistry entry plus Arbiscan/Basescan keys.
- Multi-snapshot scoring. Store score evolution over time so I can show “this token started at 30 and climbed to 80” graphs.
Try it
Free, no signup: paste any Ethereum contract address on app.rektradar.io, get the risk score and flags. The same data is exposed through the public API and TypeScript SDK if you want to build on it. If you find a token I missed flagging correctly, ping me on X or Discord, I want to know.