A wallet on Etherscan is a list of transactions. A wallet in our database is a node in a graph that connects to every contract it shipped, every wallet that funded it, every cluster it belongs to. You cannot see that on a tx page. So we built a 3D explorer.
This post is what the explorer shows, why we ship four different renderers for the same graph, and how we use it to triage scam clusters before the next rug pulls.
What the graph contains today
The numbers as of this run:
- 19,906 nodes indexed in the active explorer view (deployers, tokens, funders, exchanges, mixers, EOAs)
- 10,070,713 funding edges traced - every “wallet A sent ETH to wallet B” hop our crawler has seen
- 39,503 risk scores computed by the scoring engine (live, refreshed via WebSocket)
- 496 clusters detected - groups of wallets connected through funding patterns, treated as a single scam operation when they cross thresholds
The graph backs the public app at app.rektradar.io, the Discord bot, and the result pages. The 3D explorer below is the internal admin view we use to triage incidents.
A single deployer, 754 wallets in one cluster
This is what one scam-deployer cluster looks like when you load it in the explorer with depth 2:
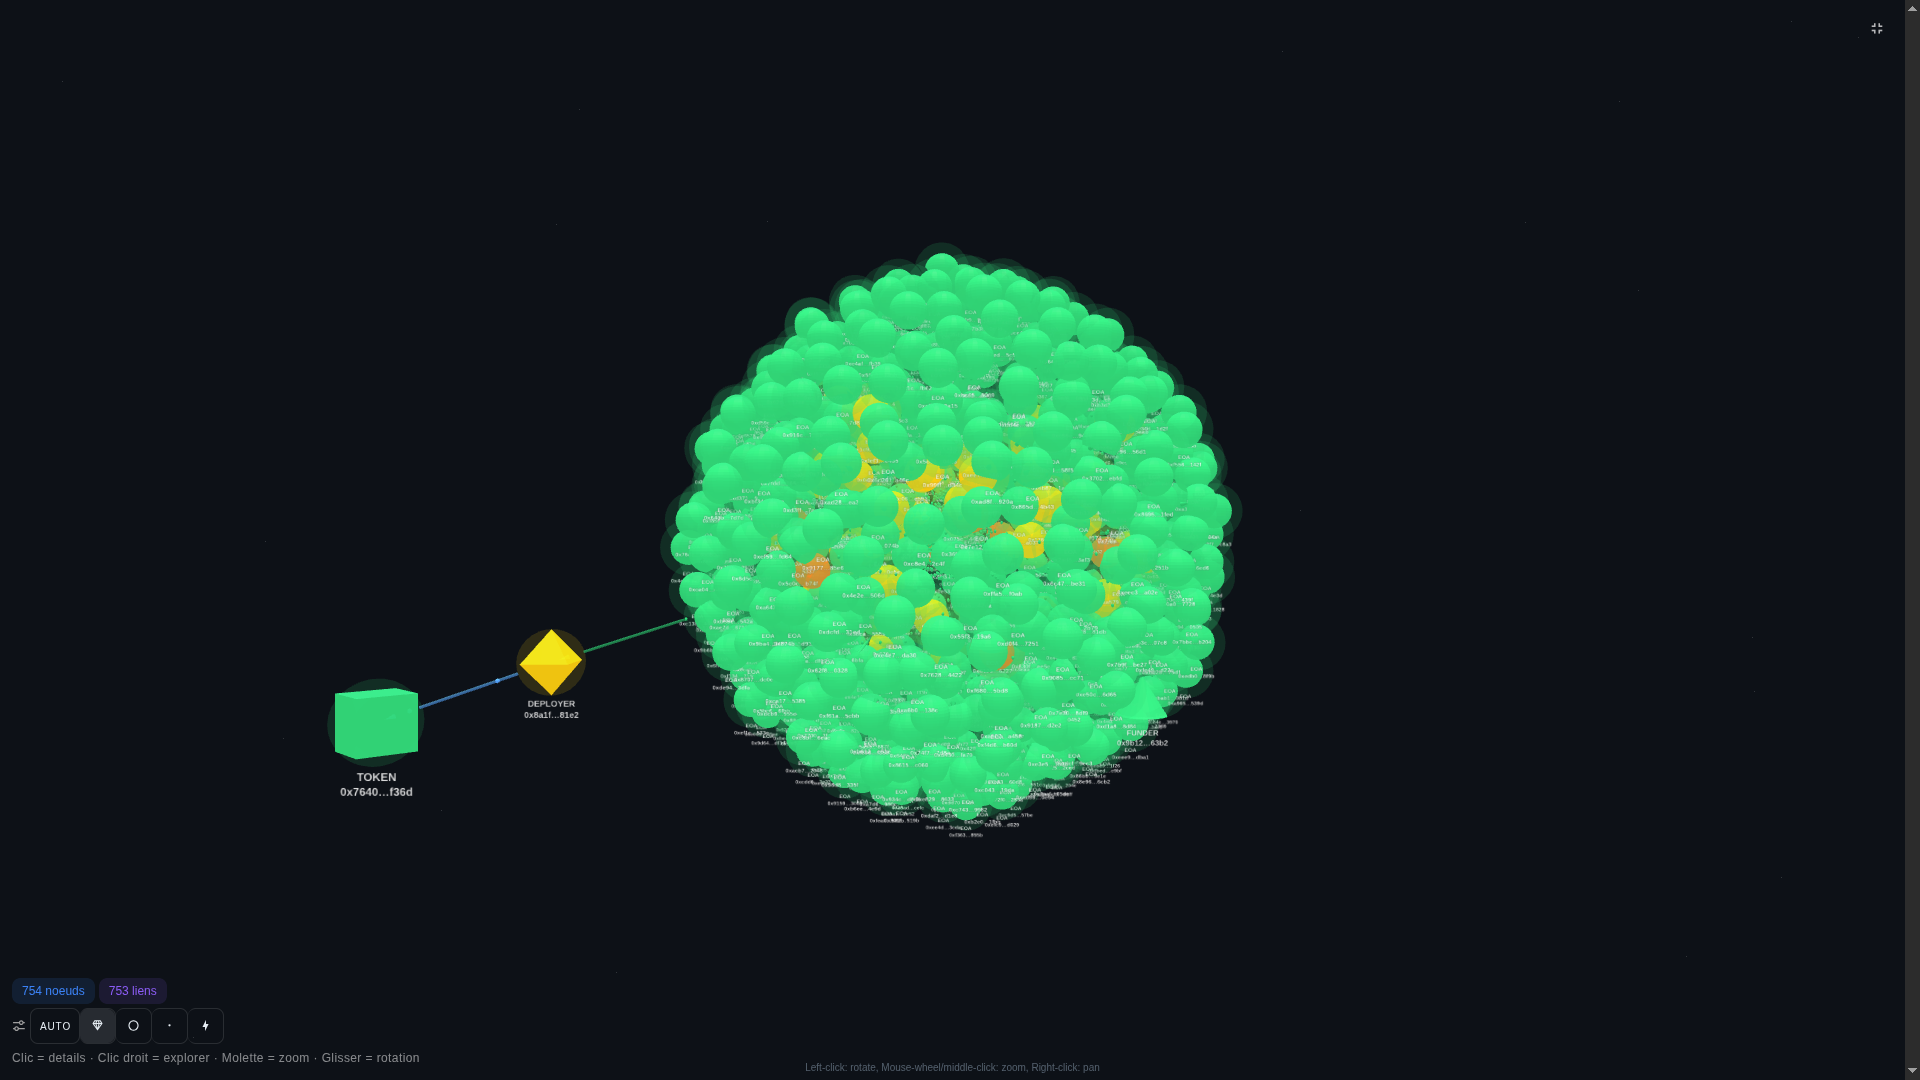
0x8a1f…81e2 (orange diamond) connected to a token contract (green cube) and the cluster of 754 wallets it has funded or seeded. 753 directed funding edges in this view alone.The orange diamond on the left is the deployer wallet. The green cube is the token contract it shipped. The blob to the right is every wallet funded - directly or transitively - by that deployer. Most of the satellite wallets are EOAs (regular accounts). The yellow patches inside the cluster are secondary deployers - wallets that themselves shipped contracts using funds that came from the same source.
Reading the same data on Etherscan would mean clicking through ~750 wallet pages. Here it is one image.
Four renderers, one graph
The same graph data feeds four different renderers, each picked for what it does best:
| Renderer | Library | Best for |
|---|---|---|
| 3D (default) | 3d-force-graph (Three.js) | Cluster shape and depth perception. Rotate, zoom, click to drill in. |
| RAW 3D | Three.js direct | Same data, no force-graph wrapper - useful when we benchmark layout perf or render custom node geometry. |
| SIGMA | Sigma.js (2D) | High-density readability - beats 3D when you need to read every label at once. |
| COSMO | Cosmograph (WebGL) | Scales to tens of thousands of nodes without dropping below 60fps. GPU compute means the layout simulation also runs there, not on the JS main thread. |
We did not pick one and stick with it because each tradeoff (perspective vs label legibility vs scale vs custom rendering) wins on a different question. The toggle lives next to the search bar and switches in under a second.
The 3D renderer hits a wall around 5-10K nodes - d3-force-3d is single-threaded JS, the simulation is O(N²), and the main thread does both layout and render. COSMO bypasses that ceiling by running the n-body simulation on GPU compute shaders.
What “very large network” looks like
The cluster above is a small sample. The largest deployer wallet currently in our database is 0xfa3e5c98…a620 - 116 contracts shipped, 100% of them flagged as scams. Loaded at depth 2 with funding-edge tracing, the explorer renders 10,001 nodes for that one address (1 deployer + 115 tokens + 2 funders + 9,883 EOAs funded along the chain) and 10,000 directed edges. Total ETH that has flowed through the cluster: ~33,600 ETH (~$76M at current price).
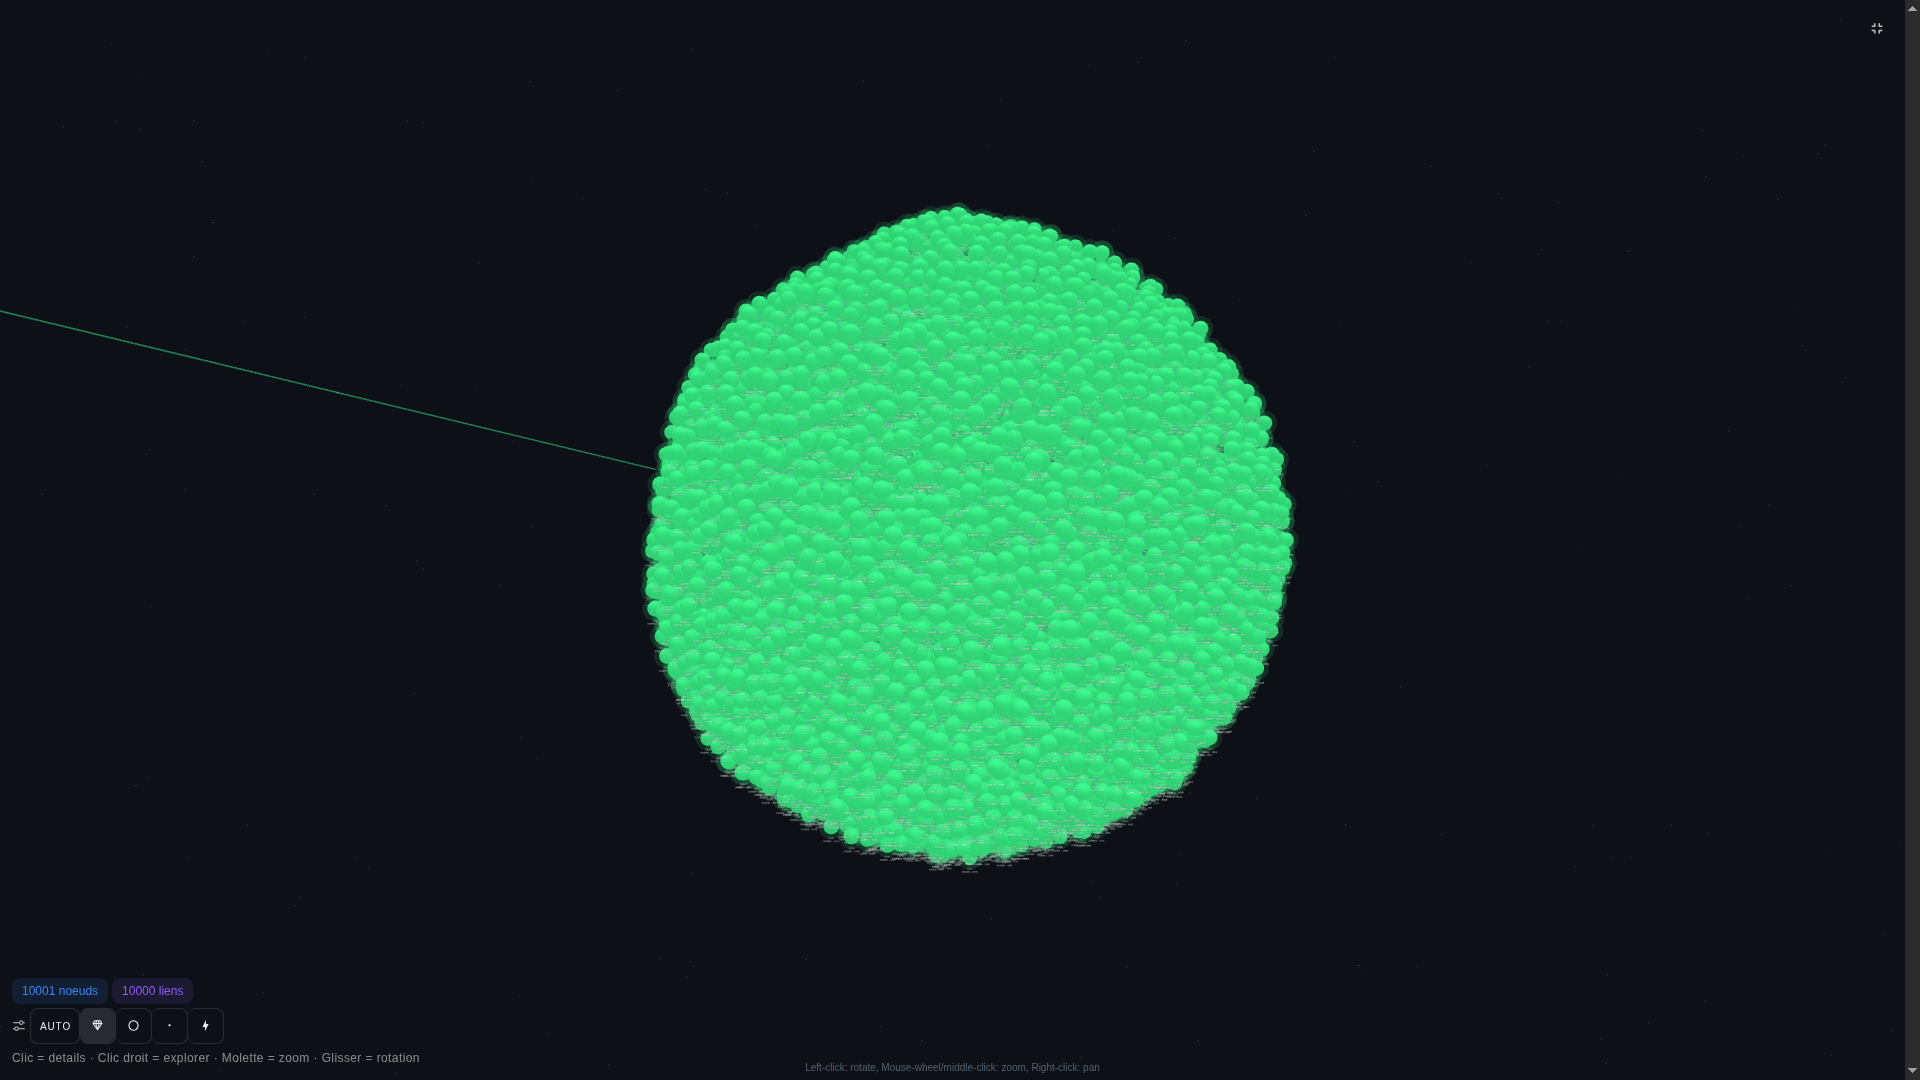
0xfa3e5c98…a620 (116 contracts shipped, 100% scam rate, ~33.6K ETH brassed). Depth 2, 3D fullscreen.Three more wallets in the same band (data updated 2026-05-05):
0x60e997de…4a72- 108 contracts, 46 scams (42.6%)0x514c52cf…630e- 104 contracts, 74 scams (71.2%)0x6f4c892a…3106- 95 contracts, 85 scams (89.5%) - every additional ship is a fresh rug
These are not edge cases. They are the top 4 deployers we currently track. The fact that one wallet ships 100+ contracts and we render the whole funding chain in a single image is the point of the explorer: pattern recognition that a tx-by-tx Etherscan flow cannot give you.
When clusters touch each other
Push the depth higher (we go up to 12 hops) and the explorer stops showing one cluster - it shows where two operations meet. Same wallet 0xedb43eb…78afc as the article anatomy, depth 12, COSMO:

The thin edge between the green main cluster and the blue secondary one is what makes this view worth the depth-12 query: it tells us a secondary deployer wallet (with its own ~300-node sub-network of EOAs and tokens) was seeded from the same upstream funding source. Treat them as one operation, not two - and every contract either of them ships is part of the same blacklist entry.
Live scores, not snapshots
The scoring engine emits a score_update WebSocket message every time a contract analysis lands. The explorer listens, and the matching node changes color in place. New clusters lighting up red as they get classified is the most useful “ambient” signal we have - you leave the tab open during a memecoin pump and watch which wallets light up while the prices move.
Color encodes either node TYPE (diamond = deployer, cube = token, triangle = funder, hex = exchange, circle = mixer, dot = EOA) or live SCORE (low = green, mid = yellow, high = red). The toggle at the top right of the legend swaps between the two without re-querying the backend.
How we use the explorer
The two flows that account for most of our time in this view:
1. Triage a fresh deployer. Paste the deployer address, depth 2 or 3. If the cluster is small (under ~50 nodes) the wallet is likely first-time and we look at the funding chain. If it is a 500+ node sphere with previous deployers inside, we treat the whole cluster as a known scam factory and flag every contract that is or will be deployed from it.
2. Trace a victim’s loss. From a withdrawing wallet, we walk the funding edges backwards through the layout. The mixer nodes (Tornado-style hops) are visually distinct (octagonal hex). Most rug pulls drop their pulled liquidity into one of those within 24h.
The full data behind the explorer comes from graph-crawler (eth2 node, Redis-cached crawls of trace_filter and trace_block) and scoring-engine (eth3 node, scores + clusters refreshed continuously). Architecture is hexagonal - see /about/ if you want the long version.
Try it
The public, read-only version of the same graph is wired into every result page on app.rektradar.io. Paste any contract address into the homepage scanner, hit Analyze, and the result page renders the deployer’s graph alongside the risk score, the flag list, and the cluster info.
If the deployer has shipped 5+ scam contracts before, the graph will tell you so before you read a single line of bytecode.